Ce matin, c’est l’heure du bilan du premier trimestre de l’année fiscale en cours (avril à juin).
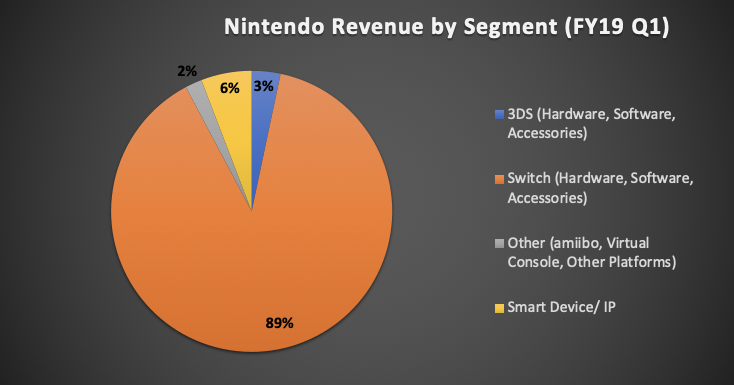
Overall
+————————————————————————–+
| | This Quarter | FY Cumulative | FY Forecast |
+————————————————————————–+
| Net Sales | ¥172,111M | ¥172,111M (~$x.xxB)| ¥1,250,000M |
| Operating Income| ¥27,428M | ¥27,428M (~$x.xxB)| ¥260,000M |
| Net Profit | ¥16,604M | ¥16,604M (~$x.xxB)| ¥180,000M |
+————————————————————————–+
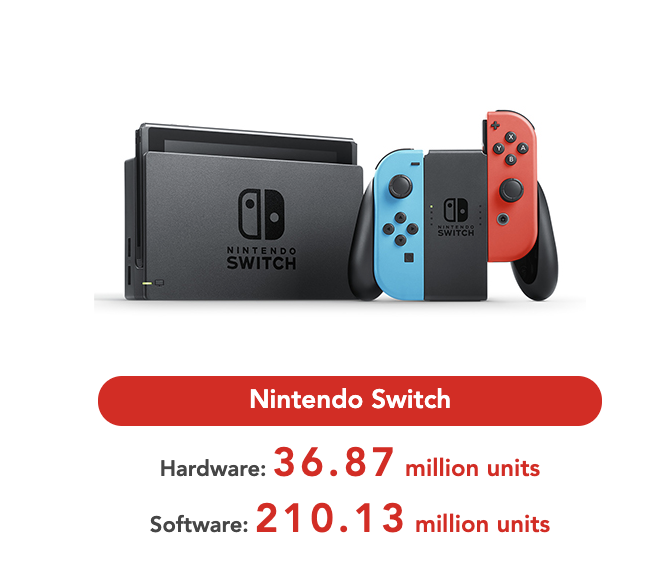
Nintendo Switch
+———————————————————————————+
| Switch | This Quarter | FY Cumulative | LTD | FY Forecast |
+———————————————————————————+
| Hardware (units)| 2.13M | 2.13M | 36.87M | 18.0M |
| Software (units)| 22.62M | 22.62M | 210.13M | 125.0M |
+———————————————————————————+
3DS
+———————————————————————————+
| 3DS | This Quarter | FY Cumulative | LTD | FY Forecast |
+———————————————————————————+
| Hardware (units)| 0.2M | 0.2M | 75.28M | 1.0M |
| Software (units)| 1.48M | 1.48M | 379.6M | 5.0M |
+———————————————————————————+
Mobile
+————————————————————————+
| | This Quarter | FY Cumulative |
+————————————————————————+
| Smart devices, IP related income, etc.| ¥10,005M | ¥10,005M |
+————————————————————————+
Supplemental Information
+————————————————————————–+
| | This Quarter | FY Cumulative |
+————————————————————————–+
| Proportion of overseas sales | 76.5% | 76.5% |
+————————————————————————–+
(※ Proportion of overseas(outside of Japan) sales to total sales)
+————————————————————————–+
| Proportion of hardware sales | 50.5% | 50.5% |
+————————————————————————–+
(※ Proportion of hardware(including accessories) sales to total
dedicated videogame platform sales)
+————————————————————————–+
| Proportion of first party software sales | 74.1% | 74.1% |
+————————————————————————–+
(※ Proportion of first-party software sales to total dedicated video
game software sales)
+————————————————————————–+
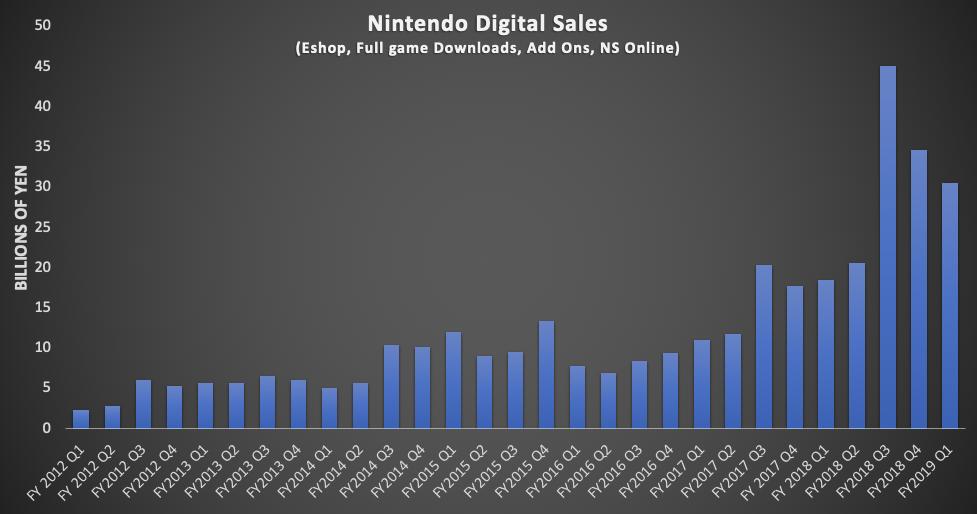
| Digital Sales | ¥30.6B | ¥30.6B |
+————————————————————————–+
(※ Digital sales include downloadable versions of packaged software,
download-only software, add-on content and Nintendo Switch Online.)
+————————————————————————–+
| Proportion of Digital Sales | 38.3% | 38.3% |
+————————————————————————–+
(※ Proportion of digital sales to total dedicated
video game software sales )
- Super Mario Maker 2 s’est vendu à 2.42 millions d’unités
- Mario Kart 8 Deluxe s’est vendu à 1.2 million sur le trimestre donc est maintenant à 17.89 million
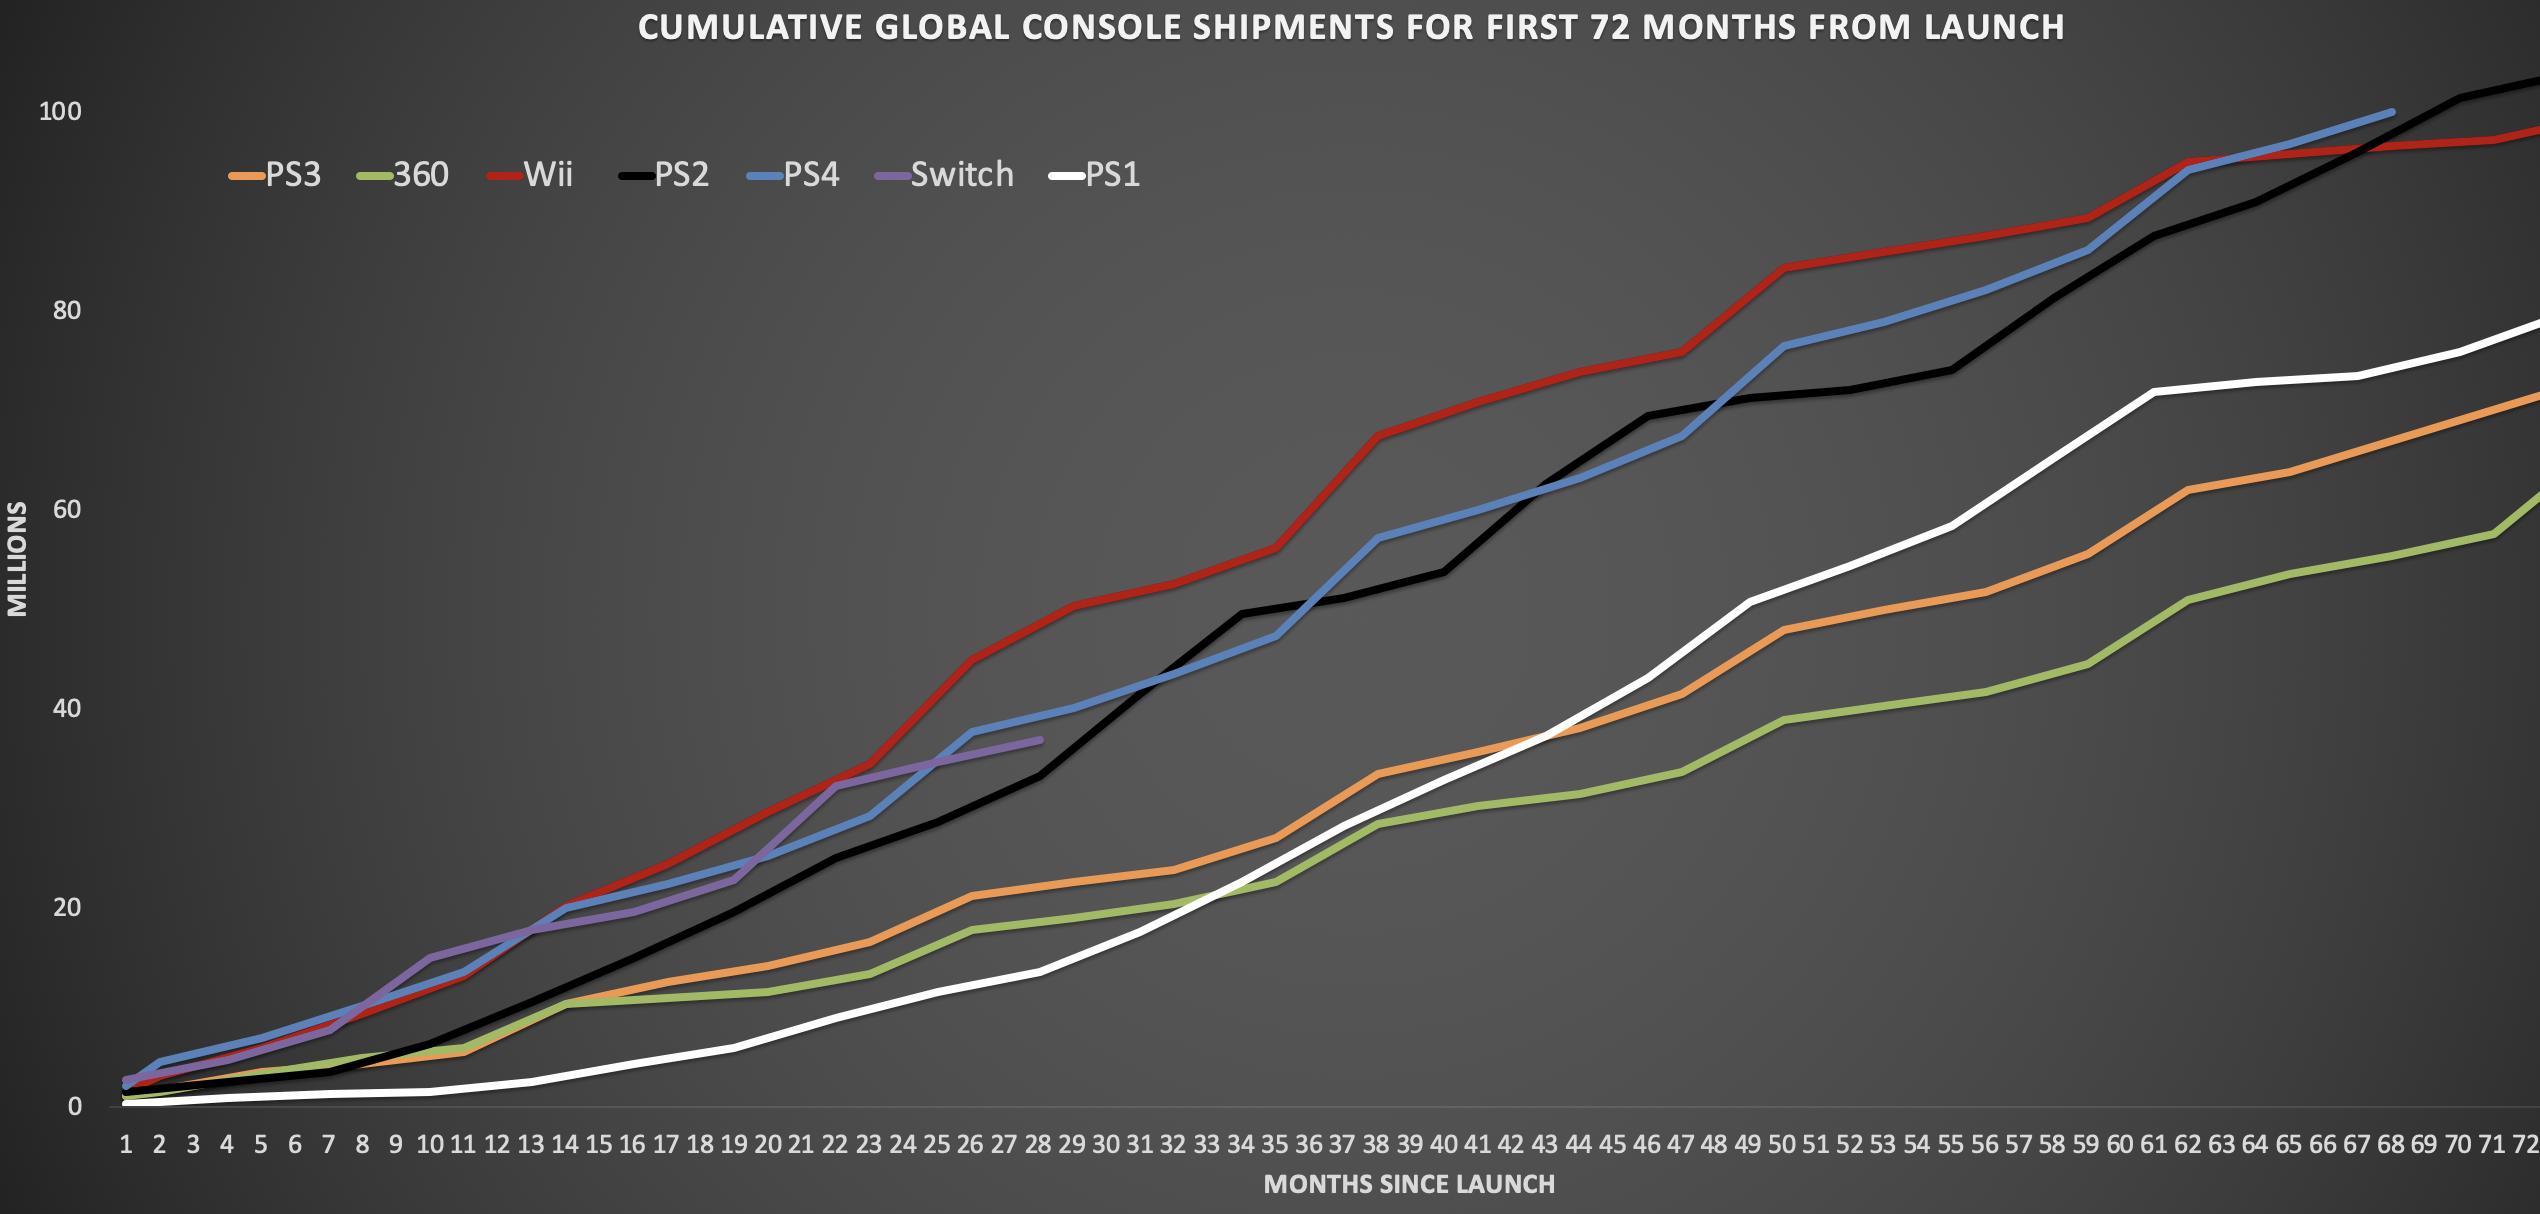
- Switch hardware monte à 2.13 millions (+13.2% year-on-year), software 22.62 millions (+25.9% year-on-year)
- Souhait de 18 millions pour l’année fiscale (donc environ 52 millions d’ici mars 2020)
- 22,62 millions de jeux vendus (210,13 millions au total)
Répartition :
– USA : 14,83 millions (40%)
– Europe : 9,6 millions (26%)
– Japon : 8,76 millions (24%)
– Autre : 3,69 millions (10%)
Coté 3DS
- 200.000 durant ce trimestre
- 75,28 millions depuis son lancement
- 379,6 millions de jeux vendus au total
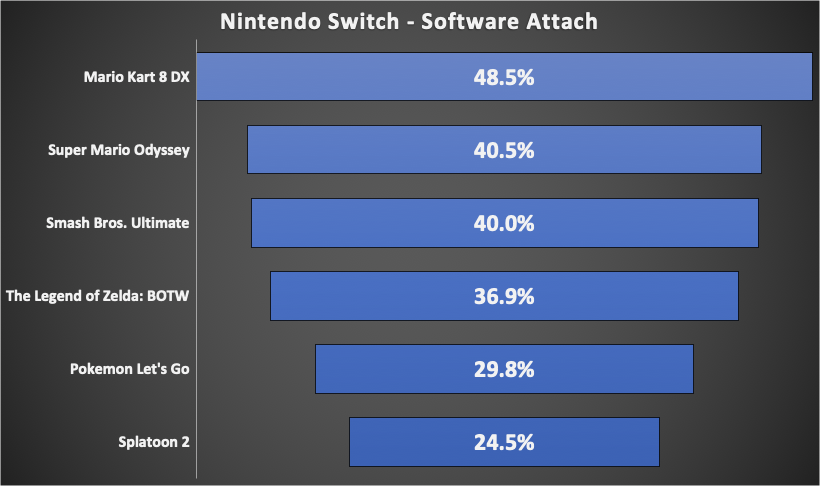
Switch
- Mario Kart 8 Deluxe – 17.89 millions
- Super Mario Odyssey – 14.94 millions
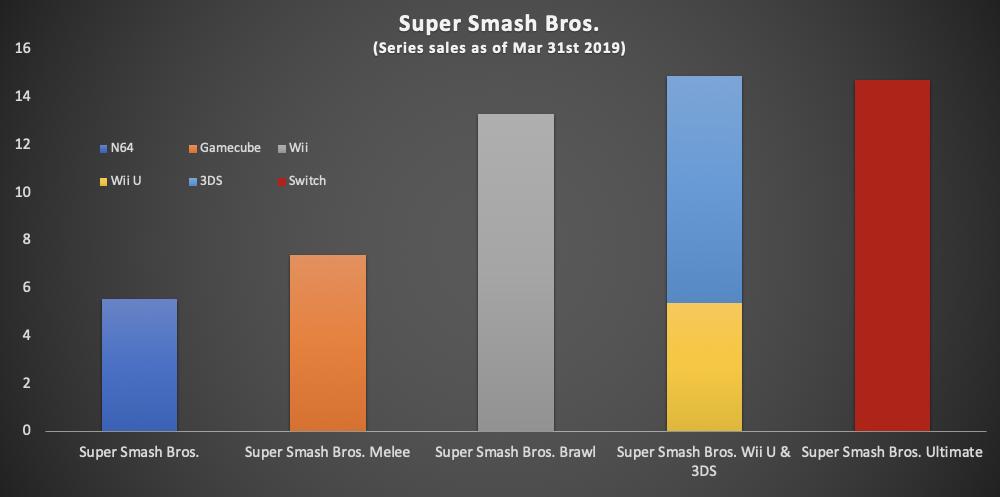
- super Smash Bros. Ultimate – 14.73 millions
- The Legend of Zelda: Breath of the Wild (Switch) – 13.61 millions
- Pokemon Let’s GO – 10.98 millions
- Splatoon 2 – 9.02 millions
- Super Mario Party – 6.99 millions
- New Super Mario Bros. U Deluxe – 4.10 millions
- 1-2 Switch – 3.01 millions
- Mario Tennis Aces – 2.75 millions
3DS
- Mario Kart 8 – 18.38 millions
- Pokemon X/Y – 16.40 millions
- Pokemon Sun/Moon – 16.16 millions
- Pokemon OR/AS – 14.21 millions
- New Super Mario Bros. 2 – 13.21 millions
- Super Mario 3D Land – 12.55 millions
- Animal Crossing: New Leaf – 12.29 millions
- Smash Bros. 3DS – 9.52 millions
- Pokemon Ultra Sun/Ultra Moon – 8.47 millions
- Tomodachi Life – 6.48 millions





J’ai mal à la tête x))
Mario kart 8 qui defonce tous comme d’hab ^^
C’est grâce au turbo XD